❝ It works. Bitches.
Science has done an awful job explaining climate change. This isn't the fault of the basic science, more the communication in explaining a complex message.
Warming Stripe
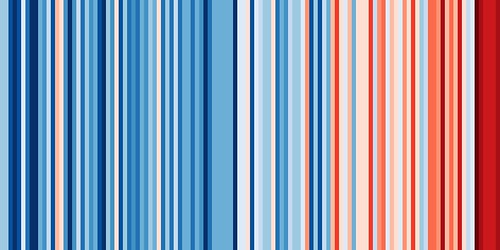
The Warming Stripe was invented by Ed Hawkins [0] in an attempt to illustrate the long term change in temperatures clearly and accurately.
The climate stripe represents the annual average temperatures for Australia collected from 1901 to 2018 above and below the average temperature. [1] Blue represents cooling, red represents warming. On average it's getting warmer. That's climate change in action. On average, it's getting hotter. If you can understand this one idea, you are one step closer to understanding the human impact of climate change.
❝ We finally figured out that you could separate fact from superstition by a completely radical method: observation. You can try things, measure them, and see how they work! - Randall Munroe, xkcd #54. [2]
Observation
How does observation work? You don't have to believe, all that's required is curiosity, an open mind and a pair of eyes.
❝ As a seven year old, I had a hunch that superstition was BS and devised an experiment to see what would happen and observed the results.
When you are young, you learn through direct observation. Walking under a ladder is bad luck, isn't it? I didn't think so. As a kid I remember thinking that bad luck, like walking under a ladder was laughable. So I tried a simple experiment. At my Primary school builders had placed a ladder against the wall to repair a something, the window or gutter. So I decided to see if this idea of walking under a ladder would be bad luck and proceeded to walk under the ladder. I repeated this seven then thirteen times. Observation in action. Nothing happened.
As an experiment it is pretty poorly designed. There are lots of other ways to measure this idea. I didn't even define clearly what is bad luck. [3] This is besides the point. I could if I wanted to improve the experiment and repeat it. I could write up the process, then publish the results and share the data. The scientific methodology was far beyond my seven year old experience, but it shows the simple idea I formulated all those years ago could be tested and improved upon by repated observation.
Warming Stripes
❝ I wanted to communicate temperature changes in a way that was simple and intuitive, removing all the distractions of standard climate graphics so that the long-term trends and variations in temperature are crystal clear. Our visual system will do the interpretation of the stripes without us even thinking about it. — Ed Hawkins, May 2018 [4]
What has this got to do with climate and the climate strip image above? At the top of each page on my blog I have added the Warming Stripe for Australia. So every time I create a post, then read it, I have a tiny reminder of how my actions are impacting the climate.
Science. It works, bitches. [5]
Reference
[0] Ed Hawkins, Graphics and lead scientist: Ed Hawkins, NCAS, UoR. Data: Berkeley Earth.
[Last accessed: Saturday 28th September, 2019]
https://twitter.com/ed_hawkins
https://showyourstripes.info
[1] Randall Munroe, xkcd, #54 Science and Science explained
[Last accessed: Saturday 28th September, 2019]
https://xkcd.com/54/
https://explainxkcd.com/wiki/index.php/54:_Science
[2] Berkeley Earth, "Berkeley Earth Surface Temperature project"
[Last accessed: Saturday 28th September, 2019]
https://en.wikipedia.org/wiki/Berkeley_Earth
[3] What is bad luck? I never bothered to define what bad luck was and simply made myself aware if anything out of the ordinary would happen.
[4] Warming Stripes, are data visualization graphics that use a series of coloured stripes chronologically ordered to visually portray long-term temperature trends.
[Last accessed: Saturday 28th September, 2019]
https://en.wikipedia.org/wiki/Warming_stripes
[5] You can read about the science of climate change in Nature
[Last accessed: Saturday 28th September, 2019]
https://phys.org/journals/nature-climate-change/
http://www.nature.com/nclimate/index.html


